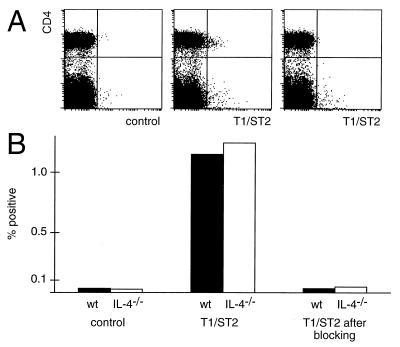
Figure 5.
T1/ST2+ cells in IL-4−/− mice. (A) Spleen cells from wt and IL-4−/− BALB/c mice were stained with mAbs against T1/ST2, CD4, and CD62L as described for Fig. 2. The control panel shows the fluorescence signal of anti-DIG-Cy5 alone. To verify its specificity, the staining of 3E10 was blocked by preincubation of the cells with a 100-fold excess of unconjugated 3E10, which reduced the subsequent 3E10 staining on CD4+ cells to control levels in both wt and IL-4−/− mice. The dot plots represent the results obtained with IL-4−/− mice. (For wt BALB/c mice see Fig. 2.) (B) Frequency of T1/ST2+ cells among CD4+ cells from wt and IL-4−/− mice, as determined in A.

