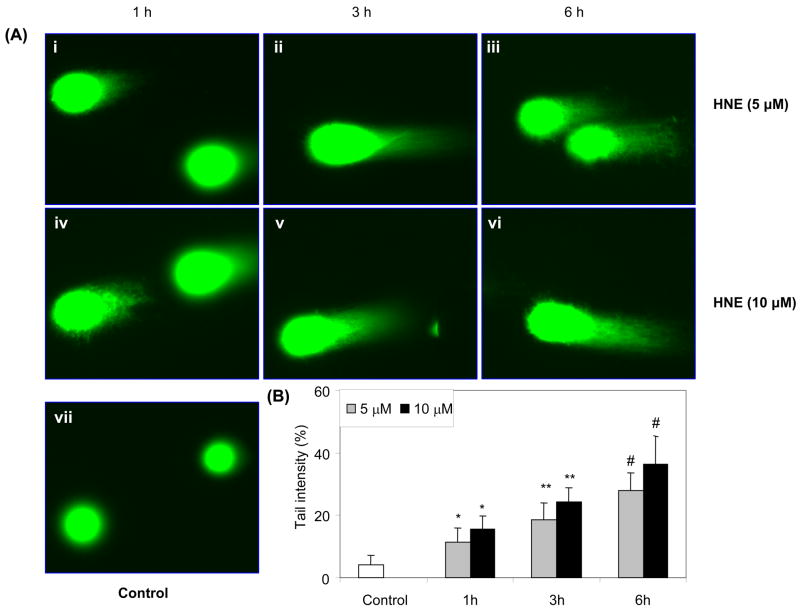
Fig. 2.
Time-dependent genotoxic effects induced by HNE in K562 cells. (A) K562 cells were incubated with 5 and 10 μM HNE for 1, 3 and 6 h and single cell gel-electrophoresis was performed to assess the DNA damage. The figure shows the representative comet tails indicative of DNA damage. (B) The bar diagram shows tail intensity (% DNA in tail) (mean ± S.D.) from three independent experiments. The results are given as mean± S.D. The mean in each case was calculated from three to four parallel slides, 40 comets were evaluated per slide. (*P < 0.05; **P < 0.01; #P < 0.001 vs control).

