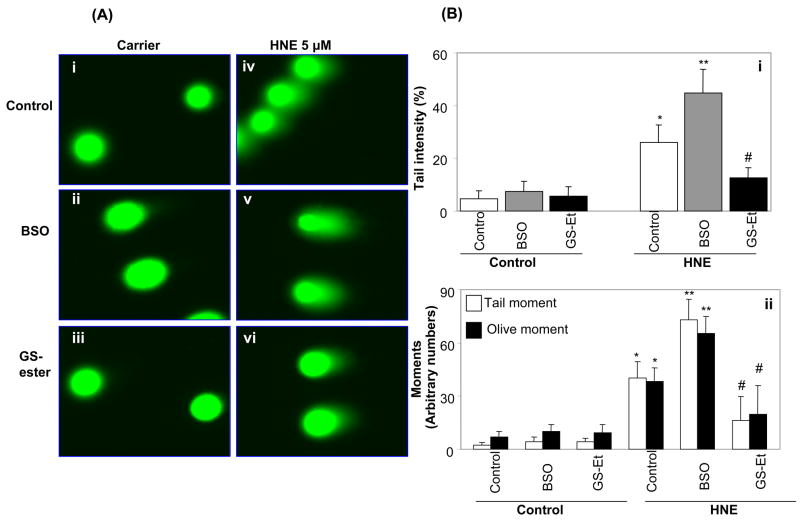
Fig. 3.
Effect of GSH depletion and supplementation on genotoxic effects induced by HNE in K562 cells. (A) K562 cells pretreated with 100 μM BSO for 16 h and with 1mM GSH-ethyl-ester (GS-ester) for 1 h and incubated with 5 μM HNE for 3 h and single cell gel electrophoresis was done to assess the DNA damage. The figure shows representative comet tails from each group indicative of DNA damage. B(i) shows tail intensity and (B)(ii) shows the tail- and olive-moments from same samples (mean ± S.D.). Three independent experiments were carried out and each mean was calculated from three to four parallel slides, 40 comets were evaluated per slide. (*P < 0.01 vs control, **P < 0.01 vs HNE alone; #P<0.001 vs HNE+BSO).

