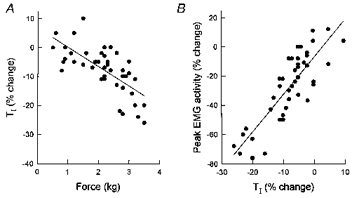
Figure 4. Example of changes in inspiratory duration during force application.

Same animal as in Fig. 3A. A, relationship between force and inspiratory duration (TI). Each circle corresponds to a single manipulated breath, and TI is expressed as a percentage change relative to TI during the preceding unmanipulated breath. Force in this animal induced a gradual reduction in TI (P < 0.001). There was therefore a relationship between the change in peak external intercostal EMG activity and the change in TI (P < 0.001), as shown in B. The slope of this relationship, however, was 2.53, thus indicating that the reduction in EMG activity was greater than the reduction in TI.
