
Figure 6. Activation kinetic of IH was different in tetrodotoxin-sensitive and -resistant neurons.
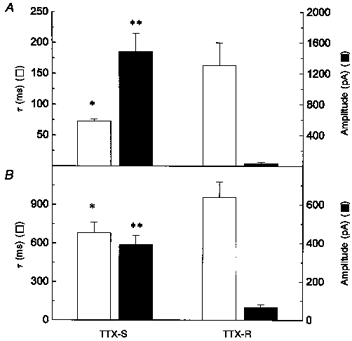
A, fast time constant of activation of IH (□) and its amplitude (▪) at -120 mV for neurons with only tetrodotoxin-sensitive sodium currents (TTX-S; n= 10) or neurons with both tetrodotoxin-sensitive and -resistant sodium currents (TTX-R; n= 10). B, second or slow time constant (□) and its amplitude (▪) of IH at -120 mV for neurons with only TTX-S sodium currents (n= 10) or neurons with both TTX-S and TTX-R sodium currents (n= 10). *P < 0.05; **P < 0.001 for comparison of TTX-S and TTX-R.