
Figure 3. The effects of decreasing extracellular [Na+] from 140 to 80 mM on Sodium Green fluorescence in the pericryptal region.
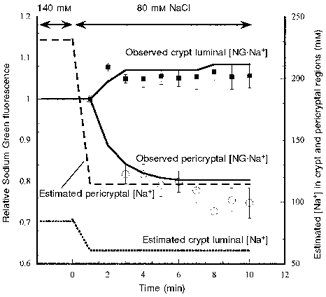
Experimental details are as described in the legend to Fig. 2. The observed pericryptal and crypt luminal fluorescence changes shown are normalized to the signals obtained immediately after making the Na+ concentration change as for Fig. 2. The lines following the points (^, pericryptal fluorescence; ▪, crypt luminal fluorescence) are simulations of the Sodium Green fluorescence data using a simple model of the pericryptal space and crypt lumen (Fig. 1B). The predicted changes in pericryptal and crypt luminal Na+ are also shown.