
Figure 8. The differences in distribution of F-actin (▪), β-catenin ( ) and E-cadherin (□) between descending colonic crypts and caecal crypts.
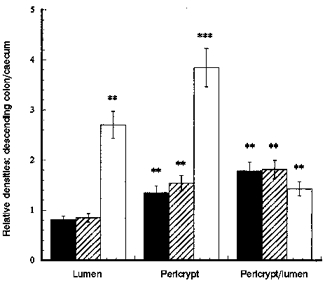
Each column shows mean values from tissue from 3 rats. Four regions of interest in the crypt and pericryptal regions from each tissue were evaluated. **P < 0.01, descending colon vs. caecum; ***P < 0.001 descending colon vs. caecum; Student's two-tailed t test.