
Figure 1. Desensitization of ‘on’ bipolar cell light responses is blocked by BAPTA.
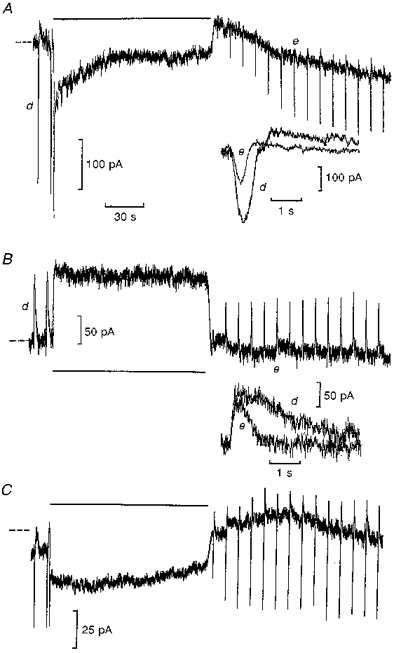
Traces A and B were recorded from ‘on’ and ‘off’ bipolar cells, respectively, from the same retinal slice without BAPTA, whilst C shows an ‘on’ bipolar cell recording with 5 mM BAPTA included in the patch pipette solution (all K+-based). Each cell was voltage clamped at zero current (dashed lines) to their dark potentials (-34, -29 and -28 mV, respectively). Each trace shows current responses (inward ‘on’ and outward ‘off’ bipolar cell responses) to test flashes bleaching 2 rhodopsin molecules per rod (2 Rh*), then light steps bleaching 200 Rh* s−1 were applied for 2 min (indicated by the horizontal bars). Traces A and B begin 30 s after going whole-cell, and the insets show flash responses before (d) and after (e) the steps as indicated on expanded time scales. Trace C, from an ‘on’ bipolar cell recorded in a different retinal slice, begins 11 min after going whole-cell, on full equilibration with the patch pipette solution containing 5 mM BAPTA with no added Ca2+.