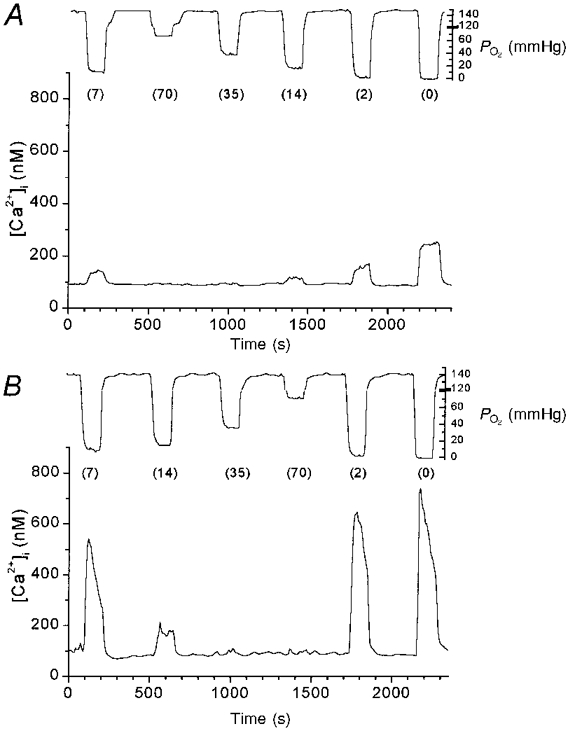
Figure 1. Effects of hypoxia on [Ca2+]i in rat type I cells.

Tracings showing [Ca2+]ivs. time during 2 experimental runs in type I cell clusters from near-term fetal rats (A) and 14-day-old rats (B). Each line represents [Ca2+]i measurements from one cluster of type I cells. The tracing from the superfusate PO2 electrode is shown above each graph. Numbers in parentheses are superfusate PO2 (in mmHg).
