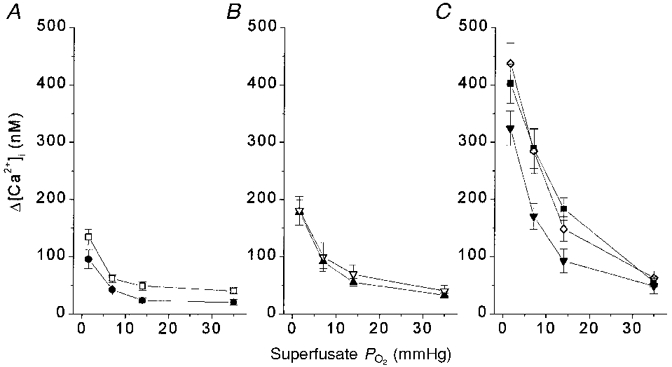
Figure 3. Δ[Ca2+]i for PO2 levels between ≈2 and ≈35 mmHg vs. age.

Δ[Ca2+]i responses to hypoxia challenge at PO2 levels of ≈2, 7, 14 and 35 mmHg at all 7 ages. A: •, fetal; □, 1 day. B: ▴, 3 days; ▿, 7 days. C:▪, 11 days; ⋄, 14 days; ▾, 21 days. Δ[Ca2+]i values at the lowest PO2 shown (≈2 mmHg) were not different between 11 and 21 days, but all were significantly greater than the corresponding responses at younger ages. With less hypoxic superfusate PO2 levels, ANOVA detected fewer significant changes with age. n= 10, 18, 8, 7, 9, 9 and 16 clusters at near-term fetal, 1, 3, 7, 11, 14 and 21 days, respectively.
