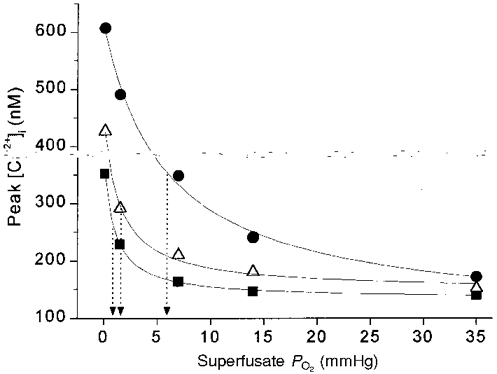
Figure 5. Rightward shift in the submaximal portion of the O2 response profile with age in pooled age groups.

Mean peak [Ca2+]i responses of carotid chemoreceptor cells from 3 age groups, plotted vs. superfusate PO2. ▪, fetal-1 day (n= 28 clusters); ▵, 3-7 days (n= 15 clusters); •, 11-21 days (n= 34 clusters). Data in each age group fitted with hyperbolic function [Ca2+]i= (a + c) - {(aPO2)/(b+PO2)} using the least-squares method. Arrows indicate superfusate PO2 at half-maximal [Ca2+]i response (b value in hyperbolic function).
