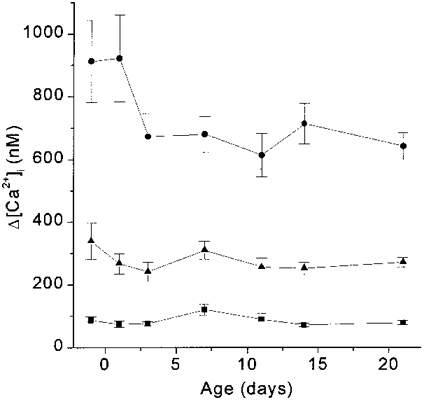
Figure 7. Development of Δ[Ca2+]i responses to elevated extracellular K+.

Δ[Ca2+]i responses to 10 mM KCl (▪), 20 mM KCl (▴) and 40 mM KCl (•). ANOVA revealed no statistically significant differences with age in the [Ca2+]i response to any concentration of KCl.
