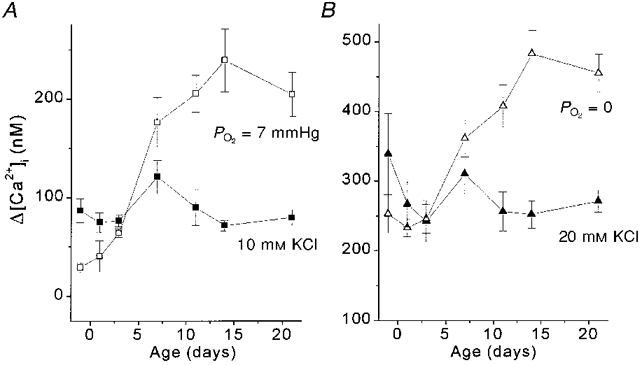
Figure 8. Maturation of [Ca2+]i response to hypoxia vs. KCl.

Δ[Ca2+]i responses to 10 and 20 mM KCl are shown with [Ca2+]i responses to hypoxia occurring in the same range. A, the Δ[Ca2+]i response to hypoxia (7 mmHg) (□) significantly increased ≈3-fold between 3 and 11 days (P < 0.001), while the response to 10 mM KCl did not change with age (▪). B,Δ[Ca2+]i response to PO2= 0 mmHg (with Na2S2O4; ▵) doubled between 3 and 14 days (P < 0.001) while the Δ[Ca2+]i response to 20 mM KCl (▴) did not change significantly with age by ANOVA.
