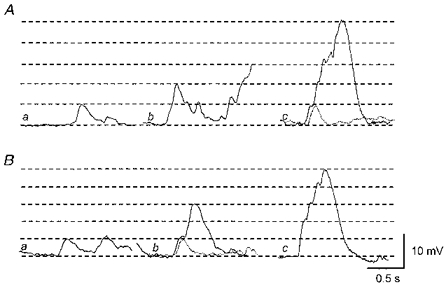
Figure 4. Summation of single unit STDs.

Aa, a single unit STD was recorded in the presence of nifedipine (1 μm). Ab, summation of 2 units. Ac, summation of 5 units. The superimposed dotted trace indicates a single unit. Ba, in a separate preparation, a single unit STD was recorded in the presence of 1 μm nifedipine. Bb, summation of 3 units. The superimposed dotted trace again indicates a single unit. Bc, summation of 5 units. A and B were recorded from 2 different tissues. The scale bars on the right refer to all traces. The horizontal lines indicate amplitudes of single unit STDs in each trace.
