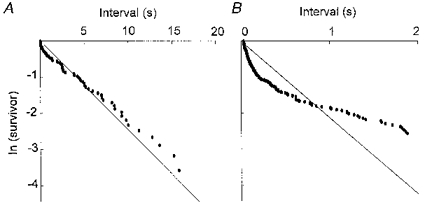
Figure 5. ln(survivor) curves plotted from the data obtained from urethral smooth muscle preparations.

A, the empirical ln(survivor) curve plotted for the whole range of intervals obtained from a preparation which exhibited STDs but not slow waves. B, the empirical ln(survivor) curve plotted for the partial range of intervals obtained from a preparation which exhibited both slow waves and STDs. All data were obtained in the presence of 1 μm nifedipine. In each case, the straight line represents the ln(survivor) curve predicted for a Poisson process of random and statistically independent events of mean frequency equal to that recorded. The empirical curves lie below the Poisson prediction for short intervals, indicating that there is an excess of closely spaced events. A, cell I of Table 1; B, cell VII of Table 1.
