
Figure 1. Hyposmotic swelling-induced current in L-fibroblasts.
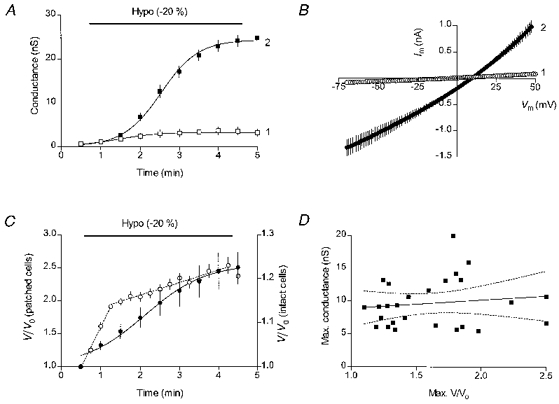
A, time course of the membrane conductance change in cells dialysed with the high-Cl− (140 mM CsCl) solution in the absence of hyposmotic challenge (□, n= 5) and during application of the hyposmotic (240 mosmol kg−1) solution (▪, n= 11). B, mean I-V characteristics for the hyposmotically swollen cells (n= 11) measured at the break-in (curve 1) and at 4.5 min (curve 2). C, comparison of hyposmotic swelling of intact and patched cells. ○, data for intact cells (the right Y-axis scale), n= 16. The regression lines were drawn with a slope of 18.5 % min−1 for the 0.5-1.25 min interval and 2.9 % min−1 for the 1.25-4.25 min interval. •, data for patched cells (the left Y-axis scale), n= 10. The cells were dialysed with a low-Cl−, gluconate-substituted pipette solution. D, correlation between the maximal swollen volumes and the swelling-induced conductances in cells dialysed with low-Cl− solutions (n= 26) and swollen by a 15 % decrease in the extracellular osmolality (to 255 mosmol kg−1). The slope of the regression line is 1.27 ± 1.90 (P= 0.510, F= 0.448). Dotted lines show the 95 % confidence intervals. Holding potential was -37 mV.