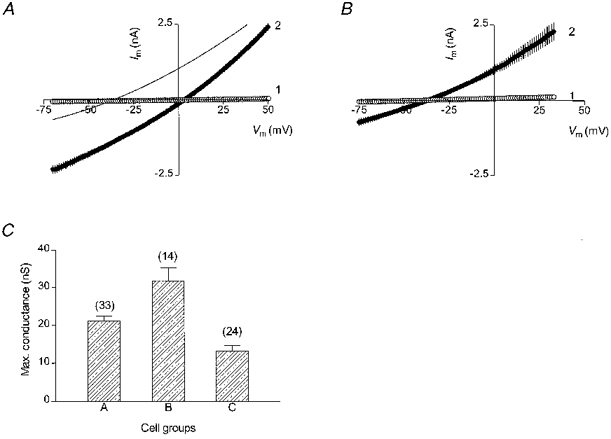
Figure 2. Chloride dependence of the swelling-induced current.

A, mean (n= 7) I-V characteristics of the swelling-induced current (curve 2) in cells dialysed with the high-Cl− (130 mM KCl) pipette solution. The extracellular hyposmotic solution (240 mosmol kg−1) contained 124 mM Cl−. Holding potential was 3 mV. Curve 1 in this (and the next) panel shows the pre-swelling I-V characteristics. The thin line shows a 2nd order polynomial fit to the I-V curve for the low-Cl− cells (from panel B) for comparison. B, mean (n= 6) I-V characteristics of the swelling-induced current (curve 2) in cells dialysed with the low-Cl− (16 mM Cl−, aspartate-substituted) solution. Holding potential was -37 mV. C, comparison of the maximal values of the swelling-induced conductance at three different transmembrane Cl− gradients (see the text). Number of cells in each group is shown above the corresponding bars.
