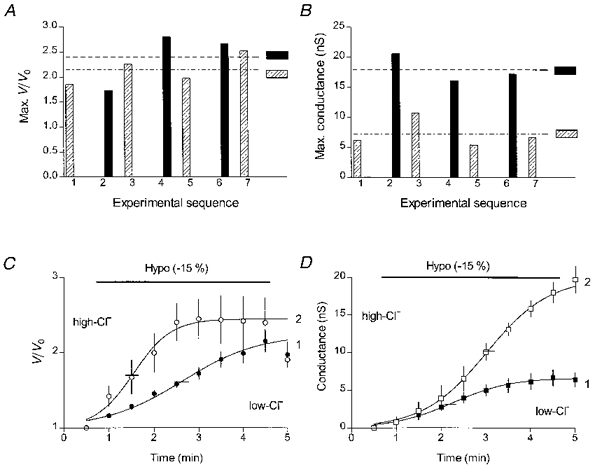
Figure 3. Kinetics of hyposmotic cell swelling and the swelling-induced conductance in patched cells at two intracellular Cl− concentrations.

A, comparison of maximal volumes of swollen patched cells from the same coverslip dialysed with either the low-Cl− (gluconate-substituted pipette solution, ) or high-Cl− solution (▪) during application of the 255 mosmol kg−1 (-15 %) hyposmotic solution. The mean volumes of swollen cells in each group are shown by the horizontal interrupted lines. B, comparison of maximal swelling-induced conductances in the same cells. The interrupted lines show the mean conductances in each cell group. C, time course of volume changes in the low-Cl− (•, n= 4) and the high-Cl− (○, n= 3) cells. Short horizontal lines (here and in panel D) cross the fitted curves at their mid-points. D, time course of the swelling-induced conductance in the low-Cl− (▪) and the high-Cl− (□) cells. Here and in the following figures, the pre-swelling conductance value has been subtracted from all conductance values.
