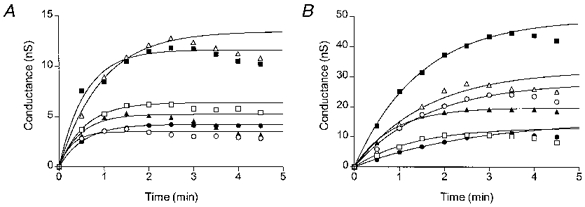
Figure 5. Kinetics of inflation-induced Cl− conductance at two intracellular Cl− concentrations.

Time courses of the inflation-induced Cl− conductance in individual low-Cl− (A) or high-Cl− (B) cells. Each cell was inflated immediately after the first measurement of the conductance (time zero in each plot). The lines are the single-phase exponential association curves fitted to the conductance values in individual cells within the first 3 min. The individual half-activation times are 0.20 (○), 0.39 (□), 0.65 (▵), 0.38 (•), 0.40 (▪) and 0.33 min (▴) for the low-Cl− cells and 1.13 (○), 0.93 (□), 1.10 (▵), 1.87 (•), 1.01 (▪) and 0.59 min (▴) for the high-Cl− cells.
