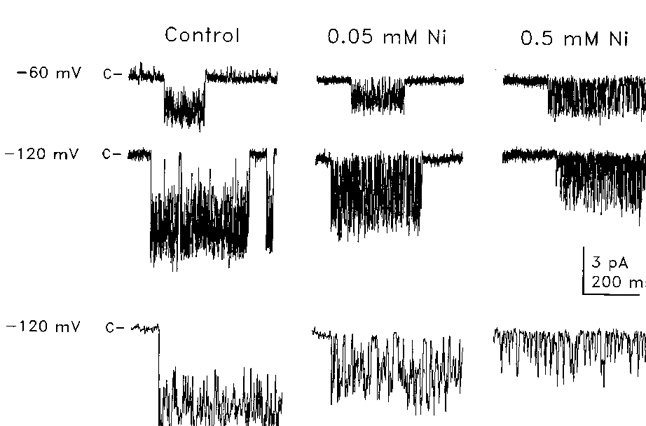
Figure 3. External Ni2+-induced fluctuations in unitary Na+ currents.

Current traces illustrating representative single channel events recorded from cell-attached patches at -60 mV (upper traces) and -120 mV (lower traces) in the absence of Ni2+ (control traces, left), in 0.05 mM Ni2+ (middle traces), and in 0.5 mM Ni2+ (right traces). The pipettes contained solution 5 (Table 1) with Ni2+ added hyperosmotically. Resting membrane potential was set to 0 mV with a high K+ saline (solution 3). Expanded time scale segments of current traces recorded at -120 mV are shown to illustrate Ni2+-induced blocking events. The closed and blocked channel current levels are indicated by c at the left of each trace. Current traces were low-pass filtered at 2 kHz.
