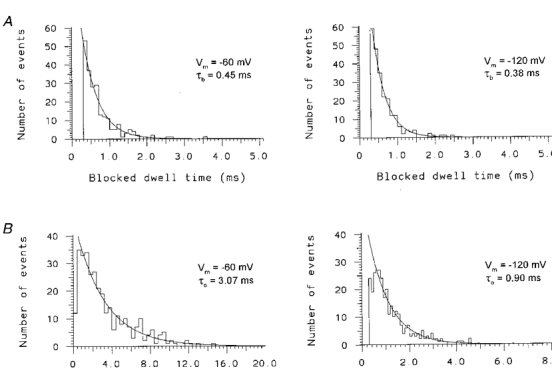
Figure 4. Open and blocked state dwell time histograms for 0.1 mM Ni2+ blockade of unitary Na+ currents.

A, blocked state dwell time histograms measured at -60 mV (left graph) and -120 mV (right graph) from a single cell-attached patch with 0.1 mM Ni2+ in the pipette solution (solution 5, Table 1). B, open state dwell time histograms measured at -60 mV (left graph) and -120 mV (right graph) from the same patch as in A. The resting membrane potential was set to 0 mV with a high extracellular K+ saline (solution 3). The smooth curves in each graph represent the maximum likelihood fit of the data to a single exponential relaxation. The time constants of the fitted exponential relaxations for τb (A) and τo (B), and membrane potentials (Vm) are indicated in the inset of each histogram.
