
Figure 4. [Ca2+]i responses to ATP and the dose-response relation.
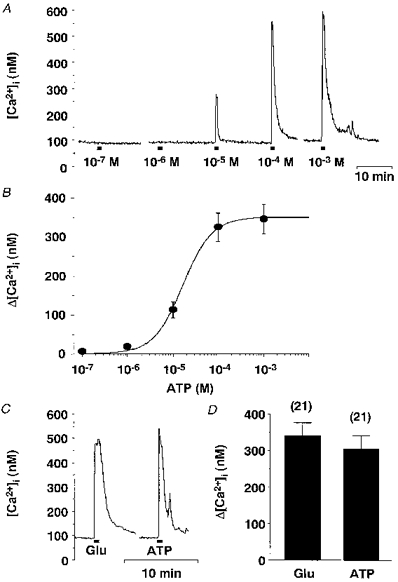
A, representative time courses for [Ca2+]i responses to increasing concentrations of ATP obtained from a single SON neurone. The breaks in the trace are approximately 5 min. Horizontal bars in this and subsequent figures indicate the time during which drugs were applied. B, increments of [Ca2+]i from the baseline (Δ[Ca2+]i) in response to various concentrations of ATP were plotted against the ATP concentrations (n= 33). The sigmoidal curve was calculated with the Hill plot and the ED50 was estimated to be 1.7 × 10⁻⁵ M from the curve. C, representative time courses for [Ca2+]i responses to glutamate (Glu, 10−4 M) and ATP (10−3 M) obtained from a single SON neurone. D, summary data for Δ[Ca2+]i in response to glutamate (10−4 M) and ATP (10−3 M). The numbers in parentheses in this and subsequent figures represent the number of neurones examined.