
Figure 7. Effects of purinergic receptor antagonists on the ATP-induced [Ca2+]i increase.
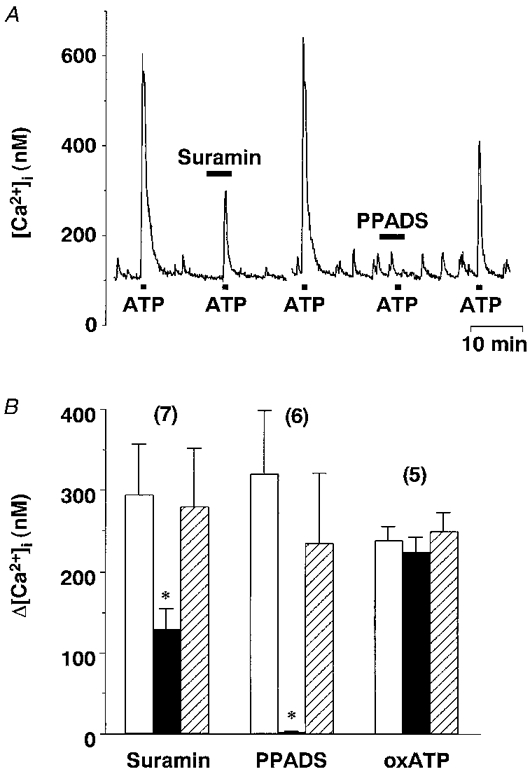
A, representative time courses showing effects of P2 antagonists suramin (10−4 M) and PPADS (10−4 M) on [Ca2+]i increases in response to ATP (10−4 M) obtained from a single neurone. The break in the trace is approximately 5 min. B, summary data for Δ[Ca2+]i in response to ATP (control, □ and  ) and ATP plus the P2 antagonist (▪). Post-controls were obtained 10-20 min after withdrawal of each antagonist. * Significantly different (P < 0.05) from the mean of the pre- and post-control values obtained with ATP alone.