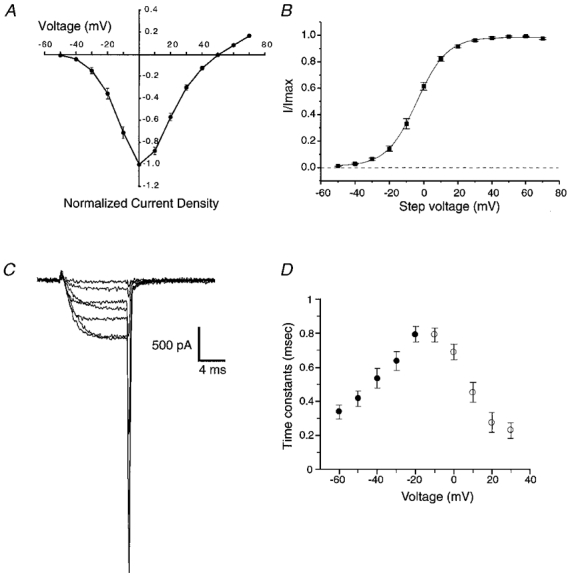
Figure 1. Properties of calcium current in stage 40 ciliary ganglion neurones.

A, current-voltage relationship obtained from six representative cells. To facilitate pooling of data from cells of different size, raw current amplitude values were divided by the capacitance recorded from each cell to obtain a current density (pA pF−1) and these were normalized to the largest value from each cell. B, voltage dependence of activation obtained by plotting normalized tail current amplitude (I/Imax) against the step potential used to activate current (means ± s.e.m.; n = 6). The continuous line represents a Boltzmann fit to the data. C, representative family of currents elicited by voltage steps between -30 and +30 mV in 10 mV increments (Vhold = -80 mV). D, time constants for calcium current activation (○) and deactivation (•) at voltages to which calcium channels are exposed during AP waveforms (means ± s.e.m.; n = 6).
