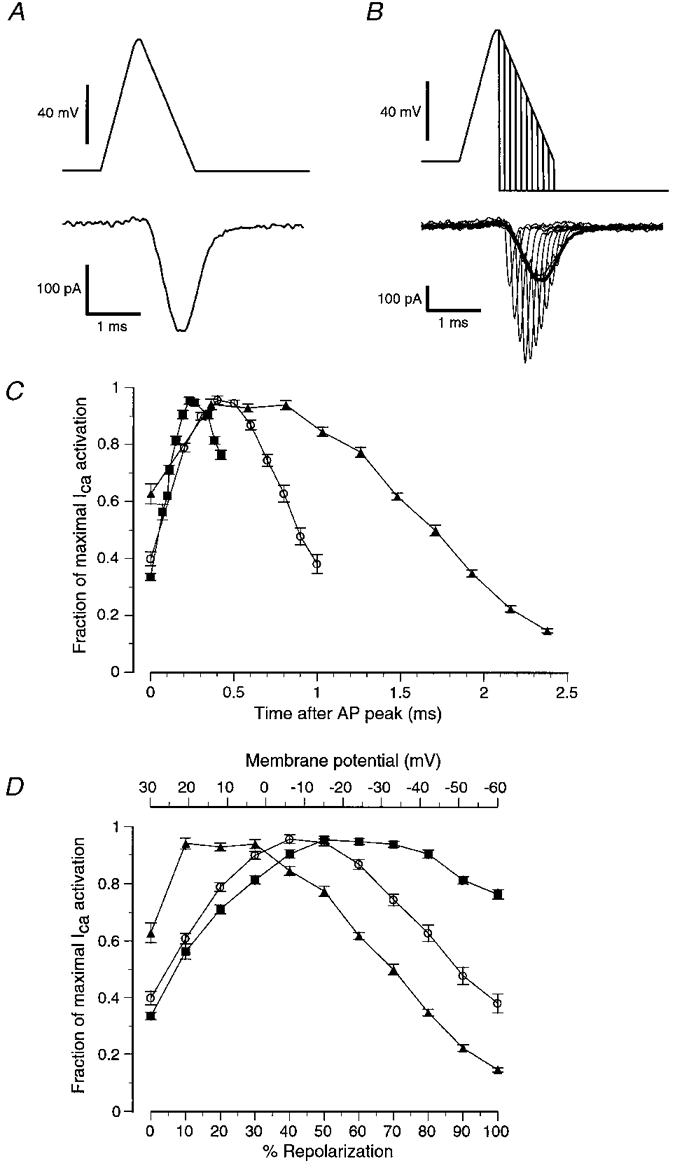
Figure 3. Estimation of the timing of calcium current activation during an AP waveform.

A, control calcium current evoked by the medium AP waveform. B, family of tail currents (thin lines) evoked by instantaneous repolarizations of the medium AP waveform to -80 mV at various times during the AP repolarization. The amplitudes of these tail currents were used to estimate the relative number of calcium channels that were open at each point in the repolarization. C and D, summary of data obtained with the protocol outlined in B using the three different AP waveforms (fast AP (▪); medium AP (○); slow AP (▴); means ± s.e.m.; n > 16). C, depending on the specific AP waveform tested, maximal calcium channel activation occurred at different times following the peak of the AP waveform. Each point represents a normalized ratio of the amplitude of the tail current evoked by the repolarization steps to -80 mV compared with the amplitude of a control AP waveform evoked current (thick line in B). The fractional activation was calculated by setting the maximum ratio in each cell to 1, and expressing the remaining ratios as fractions of 1. D, same data as in C, but plotted with membrane potential (top) or percentage AP repolarization (bottom) on the x-axis instead of time. When the slow AP was used, calcium current activation was maximal soon after the peak of the AP (+21 mV; 10 % of repolarization; ▴). For the medium AP, calcium current activation was maximal at about -6 mV, or 40 % of repolarization (○). For the fast AP, calcium current activation did not become maximal until about -15 mV, or at about 50 % of AP repolarization (▪).
