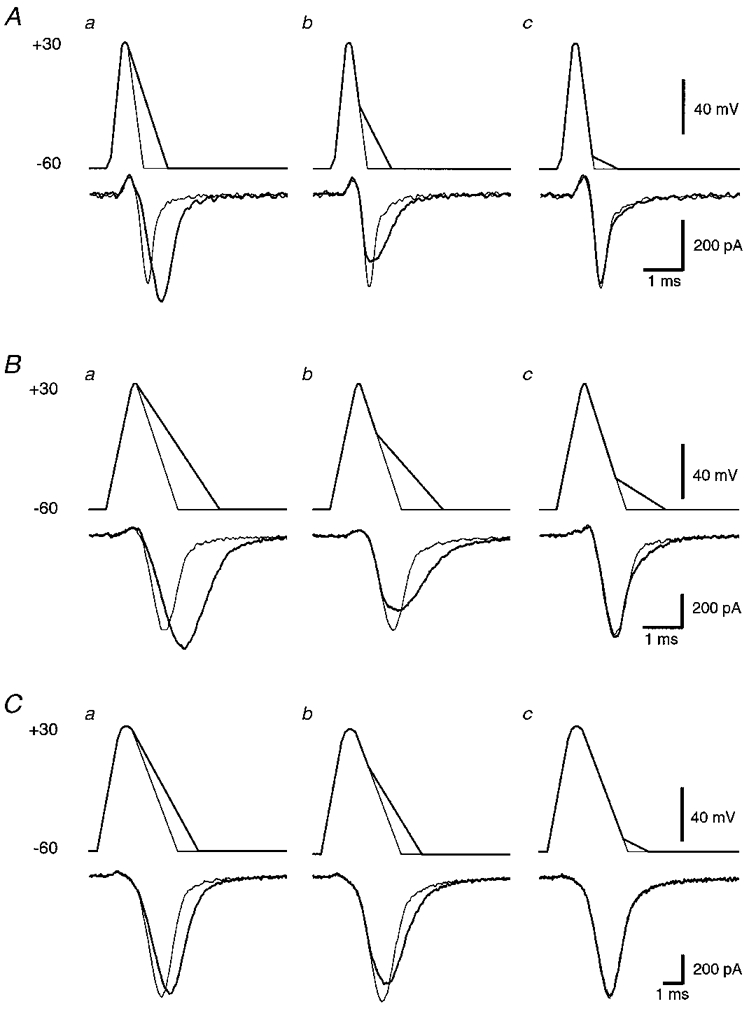
Figure 4. Effects on calcium current of broadening each of three AP waveforms at different times during repolarization.

In all cases, the control AP and associated calcium current are shown using thin lines. Broadened APs and associated calcium currents are shown using thick lines. A, fast AP broadened from the peak (a), 50 % of repolarization (b) and 90 % of repolarization (c). B, medium AP broadened from the peak (a), 40 % of repolarization (b) and 75 % of repolarization (c). C, slow AP broadened from the peak (a), 30 % of repolarization (b) and 90 % of repolarization (c). Example AP waveforms chosen for panel b in A-C were selected to represent maximal reductions in peak calcium current.
