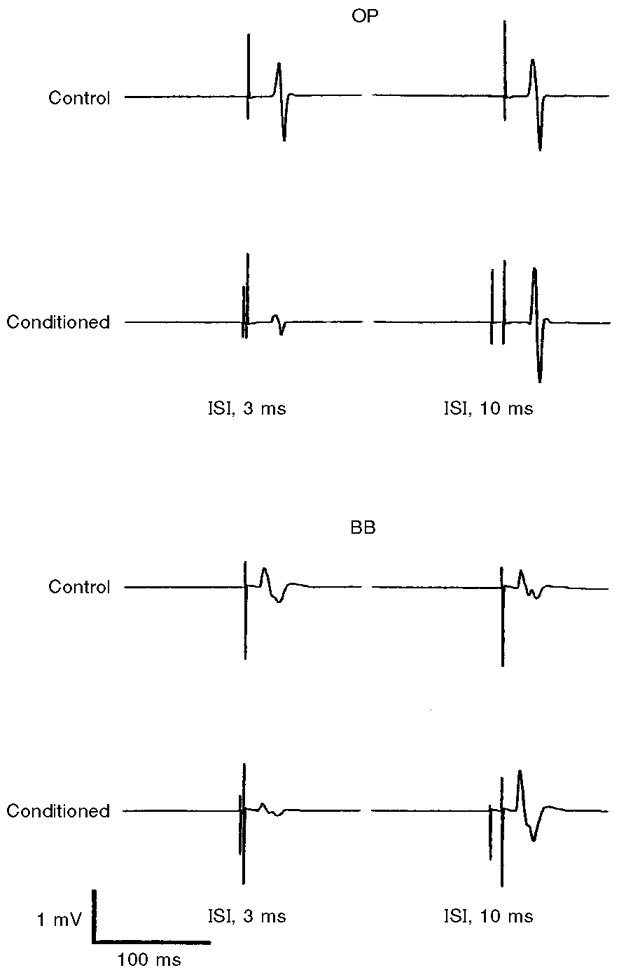
Figure 2. Examples of intracortical inhibition (ISI, 3 ms) and facilitation (ISI, 10 ms) in OP and BB muscles.

Each trace is the average of 5 recordings from the OP and BB muscles in a single representative subject. The test MEP of the OP muscle was largely inhibited at an ISI of 3 ms and slightly facilitated at an ISI of 10 ms. Less inhibition and more facilitation was observed for the corresponding ISIs in the BB muscle. Stimulus intensities and coil as in Fig. 1.
