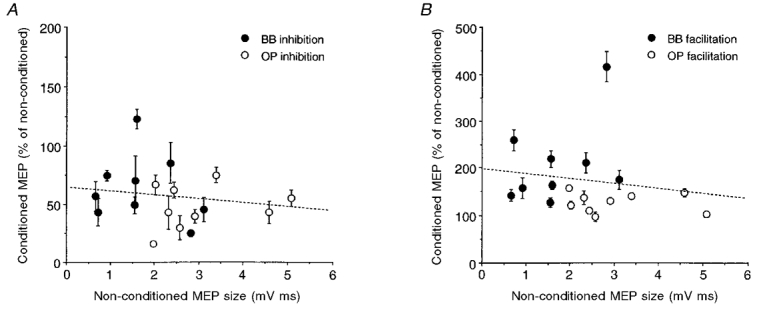
Figure 5. Relationship between the degree of intracortical inhibition and facilitation and absolute MEP size in OP and BB muscles.

The percentage mean inhibition (±s.e.m.) at ISIs of 2-5 ms (A) and facilitation at ISIs of 10-25 ms (B) of each subject (n = 9) are plotted against the respective absolute mean size of the test MEPs. In spite of test MEPs being of smaller size in the BB (•) than in the OP (○), conditioning stimulation seemed to induce quantitatively different inhibitory and facilitatory effects in the two muscles. The slopes of the dashed lines (best fitting the pooled data) are not significantly different from zero. Stimulus intensities and coil as in Fig. 1.
