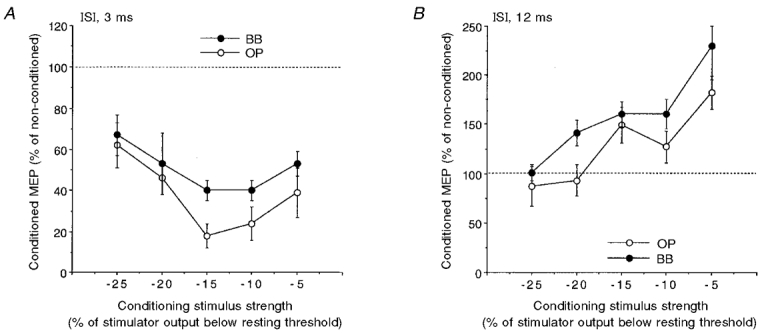
Figure 7. Effect of varying the conditioning stimulus intensity on intracortical inhibition and facilitation of size-matched MEPs of OP and BB muscles.

Intracortical inhibition (ISI, 3 ms; A) and facilitation (ISI, 12 ms; B) in the relaxed OP (○) and BB (•) muscles. A figure-of-eight coil with a stimulus intensity evoking test MEPs of a matched size in the two muscles was used. The conditioning stimulus intensity was progressively reduced in 5 % steps of the stimulator output starting from the rest threshold value. Each point corresponds to the mean value (±s.e.m.) in 6 subjects. The maximum amount of intracortical inhibition (A) was greater in the OP than in the BB, irrespective of the absolute conditioning stimulus intensity; conversely, the maximum amount of intracortical facilitation (B) was greater in the BB than in the OP muscle.
