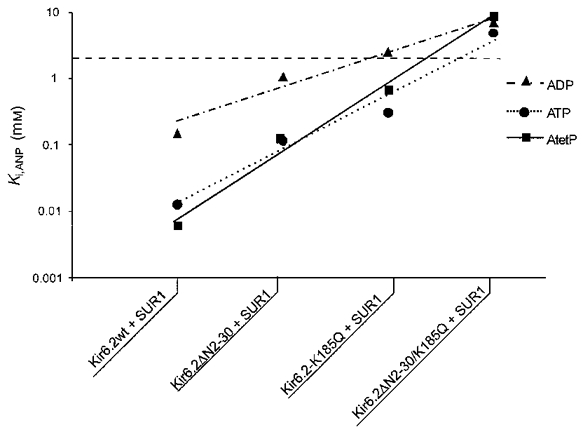
Figure 9. Relative sensitivity of mutant KATP channels to inhibition by adenosine nucleotides.

Calculated Ki for ATP, ADP and AtetP from Fig. 8 for mutant KATP channels. The dashed line above 3 mM indicates unreliability of estimated parameters. The lines connect values predicted by adjustments to the model of Fig. 10 (see text for details).
