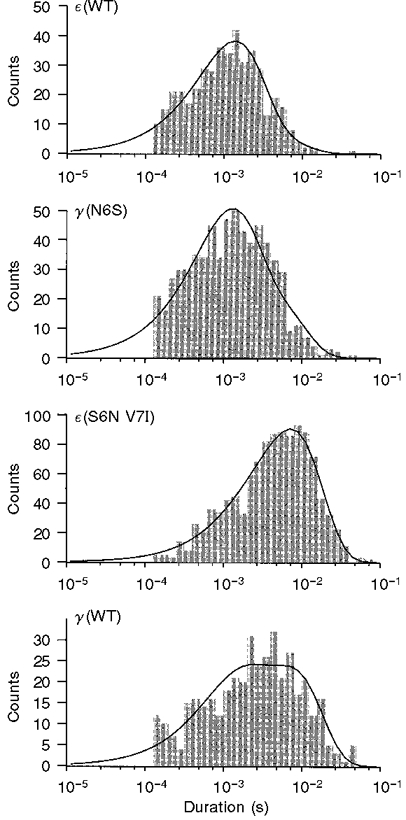
Figure 3. Open duration histograms of single channel events, illustrating effects of M2 mutations on channel open time.

The curves are fitted with double exponential functions, which were used to compute the following weighted mean open times: ε(WT), 1.73 ms; γ(N6S), 2.09 ms; ε(S6N V7I), 7.28 ms; γ(WT), 5.36 ms.
