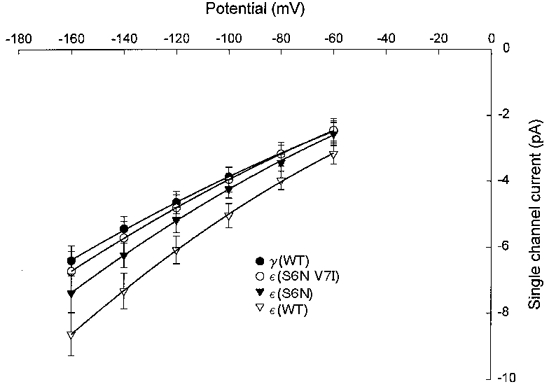
Figure 7. Effect of ε-subunit M2 mutations on channel slope conductance.

Each data point represents the mean ±s.d. channel current at a given potential from oocytes injected with wild-type α-, β- and δ-subunits plus the construct indicated. The pooled I-V data for each construct listed were fitted by 2nd order polynomial functions. The coefficients of the fitted curves were used to compute the slope conductance at -100 mV. The estimated slope conductances were: γ(WT), 37.3 pS; ε(S6N V7I), 40.8 pS; ε(S6N), 45.4 pS; ε(WT), 51.9 pS.
