
Figure 1. The voltage dependence of FM1-43 fluorescence.
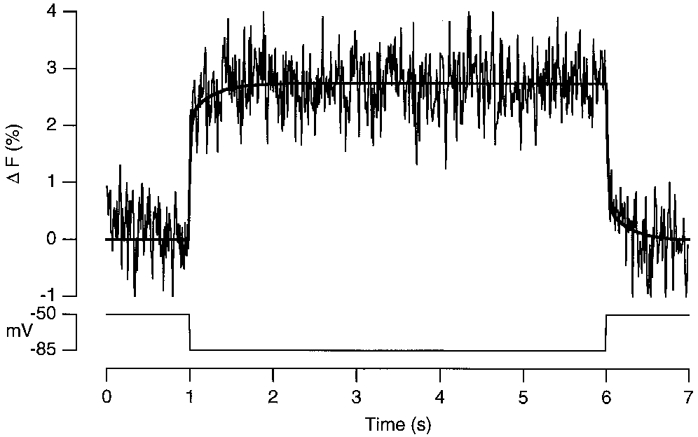
The change in fluorescence of FM1-43 in the plasma membrane in response to a 5 s hyperpolarization from -50 to -85 mV. Averaged from the same 13 cells used to measure the average time course of exocytosis in Fig. 3C and D. Twenty per cent of the change in fluorescence occurred with a time constant of 0.28 s.