
Figure 12. Increasing stimulus duration increased the amount of membrane recycled by slow endocytosis.
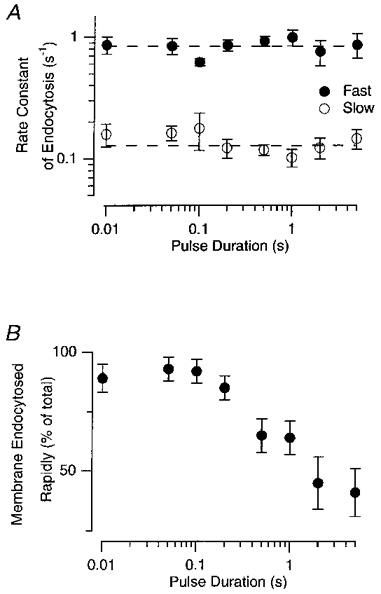
A, the values of the fast and slow rate constants plotted as a function of stimulus duration. Each point is the mean of between 15 and 27 measurements, and error bars show ± 1 s.e.m. The dashed lines represent the values of the fast and slow rate constants averaged over all pulse durations (fast = 0.84 s−1 and slow = 0.13 s−1). Note the logarithmic axes. B, the percentage of membrane endocytosed through the fast mechanism plotted as a function of stimulus duration. Note that the results only apply to the period over which the fall in capacitance was described by the fitted function, which was the great majority of the falling phase. This method of analysis did not, therefore, take into account membrane that was recycled during the depolarizing pulse or in the delay period between closure of Ca2+ channels and the cessation of exocytosis.