
Figure 2. Slow inactivation develops faster and more completely in μ1 than in hH1.
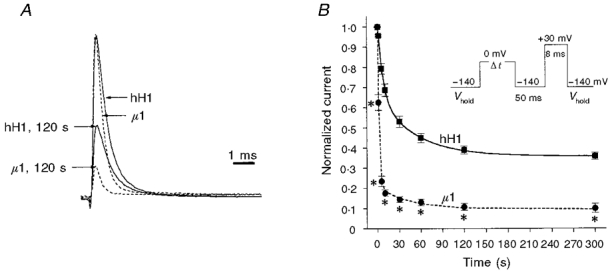
Peak Na+ current was recorded with a test pulse to +30 mV after various times at 0 mV, with an intervening step to -140 mV for 50 ms to allow recovery from fast inactivation (inset in B). Current was normalized to the initial peak value. Cells were held at -140 mV for > 2 min between pulses. A, normalized traces of outward Na+ current from hH1 (continuous lines) and μ1 (dashed lines) recorded at +30 mV from Vhold of -140 mV. Note that μ1 decays faster than hH1. The smaller traces were recorded after slow inactivation was induced with depolarization to 0 mV for 120 s. B, mean ±s.e.m. values for development of slow inactivation in hH1 (▪; n = 11) and μ1 (•; n = 10). The voltage protocol is shown in the inset. The data were fitted with a double exponential function. *P < 0.05vs. hH1.