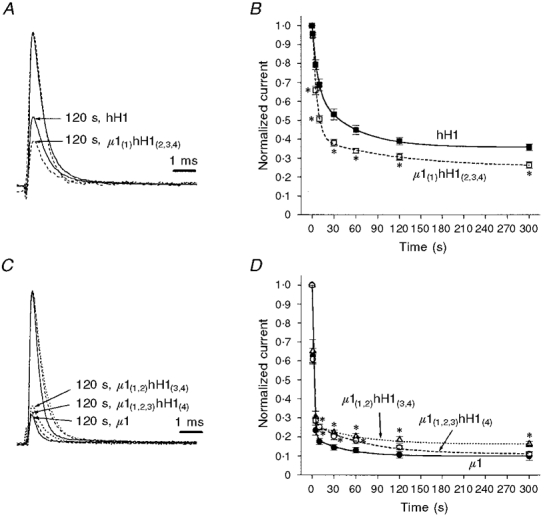
Figure 3. Development of slow inactivation in Na+ channel chimaeras is intermediate relative to that in hH1 and in μ1.

Data were collected as described in Fig. 2. A, development of slow inactivation in μ1(1)hH1(2,3,4) is more similar to that in hH1 than to that in μ1. Normalized representative traces for hH1 (continuous lines) and μ1(1)hH1(2,3,4) (dashed lines) before (larger traces) and after (smaller traces) depolarization to 0 mV for 120 s are shown. B, mean ±s.e.m. values for hH1 (▪, continuous line; n = 11) and μ1(1)hH1(2,3,4) (□, dashed line; n = 8) were fitted with a double exponential function. *P < 0.05vs. hH1. C, normalized traces from μ1 (continuous lines), μ1(1,2)hH1(3,4) (dotted lines), and μ1(1,2,3)hH1(4) (dashed lines) before and after depolarization to 0 mV for 120 s to induce slow inactivation. D, mean ±s.e.m. values for μ1 (•, continuous line; n = 10), μ1(1,2)hH1(3,4) (▵, dotted line; n = 8) and μ1(1,2,3)hH1(4) (○, dashed line; n = 10) were fitted with a double exponential function. *P < 0.05vs.μ1.
