
Figure 9. Root mean square head and smooth component gaze velocity derived by FFT analysis (experiment 3).
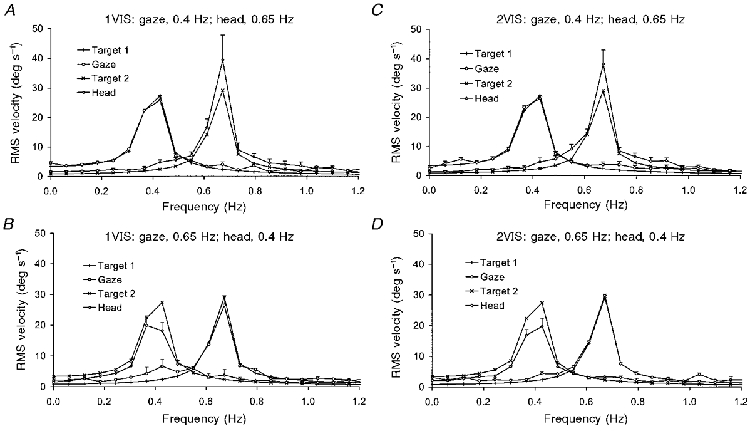
Mean of 9 subjects +1 s.e.m.A, 1VIS condition, gaze follows target 1 at 0.4 Hz, head follows target 2 at 0.65 Hz; B, 1VIS condition, gaze follows target 1 at 0.65 Hz, head follows target 2 at 0.4 Hz. C and D show the response to the 2VIS condition, with the same target frequency configurations as A and B.