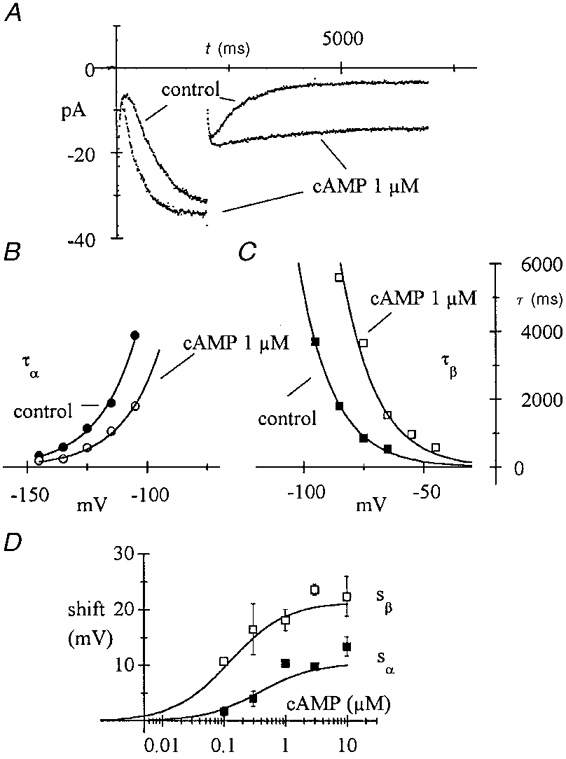
Figure 5. Differential action of cAMP on f-channel activation and deactivation time constants.

A, in one macropatch, activation steps were applied from -35 to -135 mV for 2 s and then to -85 mV for 5 s in control conditions and during exposure to 1 μM cAMP, as indicated. Time constants were evaluated according to square-exponential kinetics during activation and deactivation as in Fig. 4. These were 570 and 233 ms at -135 mV and 1792 and 5586 ms at -85 mV in control and cAMP, respectively. B and C, voltage dependency of time constants of activation (B, V < = -105 mV) and deactivation (C, V > = -95 mV) for the same patch as in A. cAMP-induced shifts were measured fitting time constant curves with the following eqns (reciprocals of rate constant eqns of type (1) of Methods): τα(V) =τ0α exp((V - sα) /Vr); τβ(V) =τ0β exp(- (V - sβ)/Vr) (curves). Control data (•, ▪) were first fitted setting sα = 0 (sβ = 0) and the resulting parameters τ0α and Vr (τ0β and Vr) were used to fit the corresponding cAMP data (○, □) by optimization of the shift parameter sα (sβ). D, plots of mean ±s.e.m. shifts for activation (□) and deactivation time constant curves (▪) against cAMP concentration. Data from 31 exposures on 17 patches. Differences between activation and deactivation values were significant at all cAMP concentrations (P < 0.05). Curves represent eqn (A8) with the fixed parameters: Vr = 2 v = 14.206 mV, KR = 0.0732 μM and KT = 0.4192 μM (from Fig. 2B fitting) and the free parameter Km = 0.26 μM, found by a least-squares fitting procedure.
