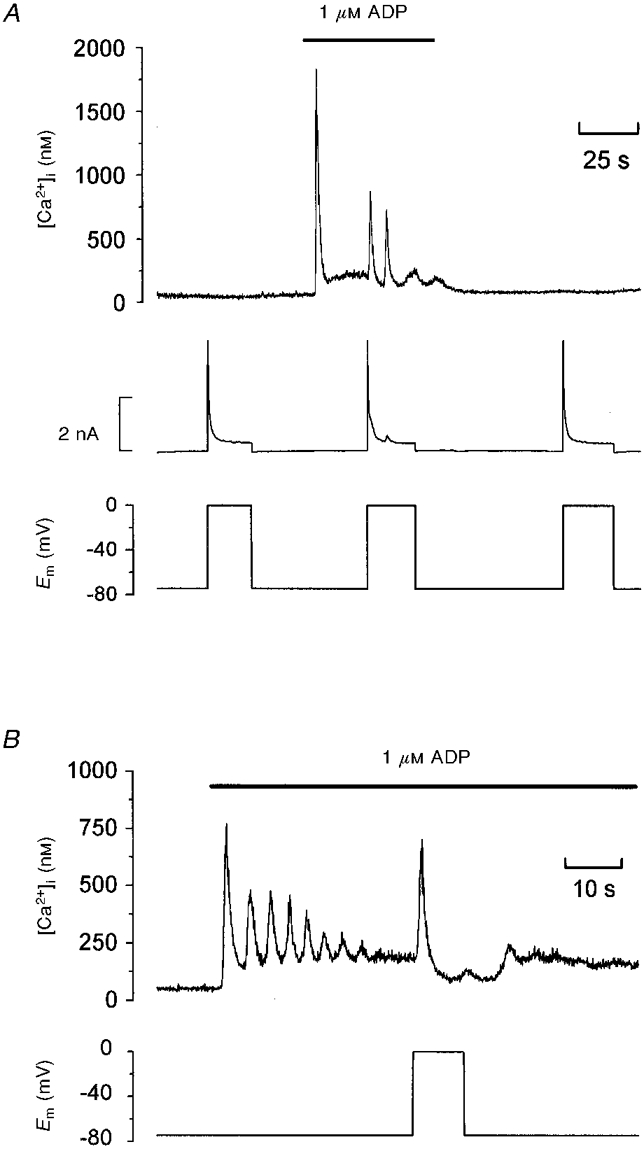
Figure 1. Depolarization-evoked [Ca2+]i increases during exposure to ADP.

A and B, simultaneous recordings of [Ca2+]i and membrane potential (Em) under whole-cell voltage clamp; the whole-cell current is also shown in A (middle trace). The bars indicate extracellular application of 1 μM ADP. A and B are from two different megakaryocytes representing the range of [Ca2+]i responses to ADP and depolarization.
