
Figure 2. Effect of TEA on the electrical activity of intact murine colonic smooth muscle.
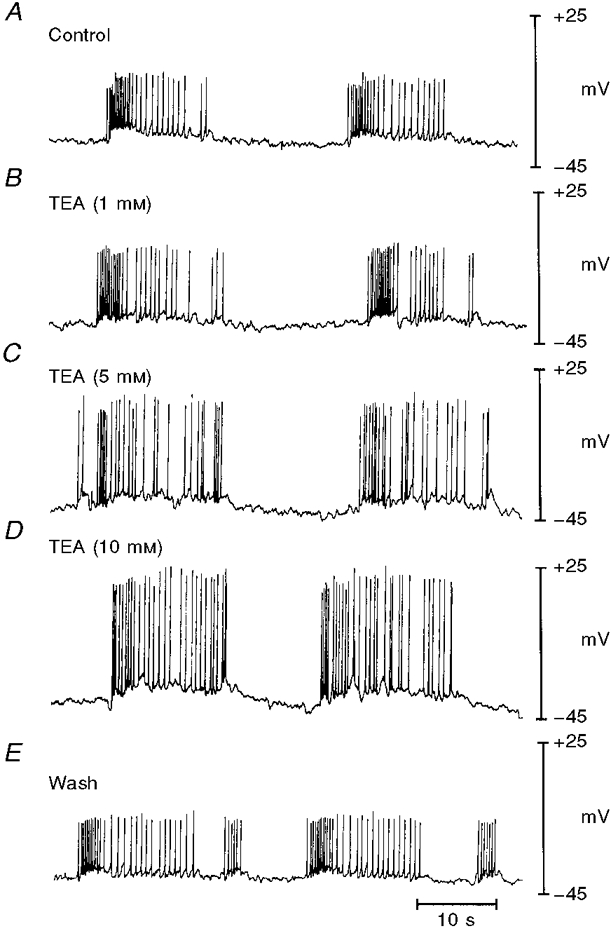
The traces are sequential records of membrane potential from a single preparation exposed to increasing concentrations of TEA (washed out between runs) in the presence of 100 μM L-NAME, as described in the text. A and B, control and activity in 1 mM TEA recorded from the same cell. C, D and E are from different impalements and show electrical activity in 5 and 10 mM TEA and following wash-out of the compound.