
Figure 5. LDH release as a function of shear stress (A) and as a function of time (B).
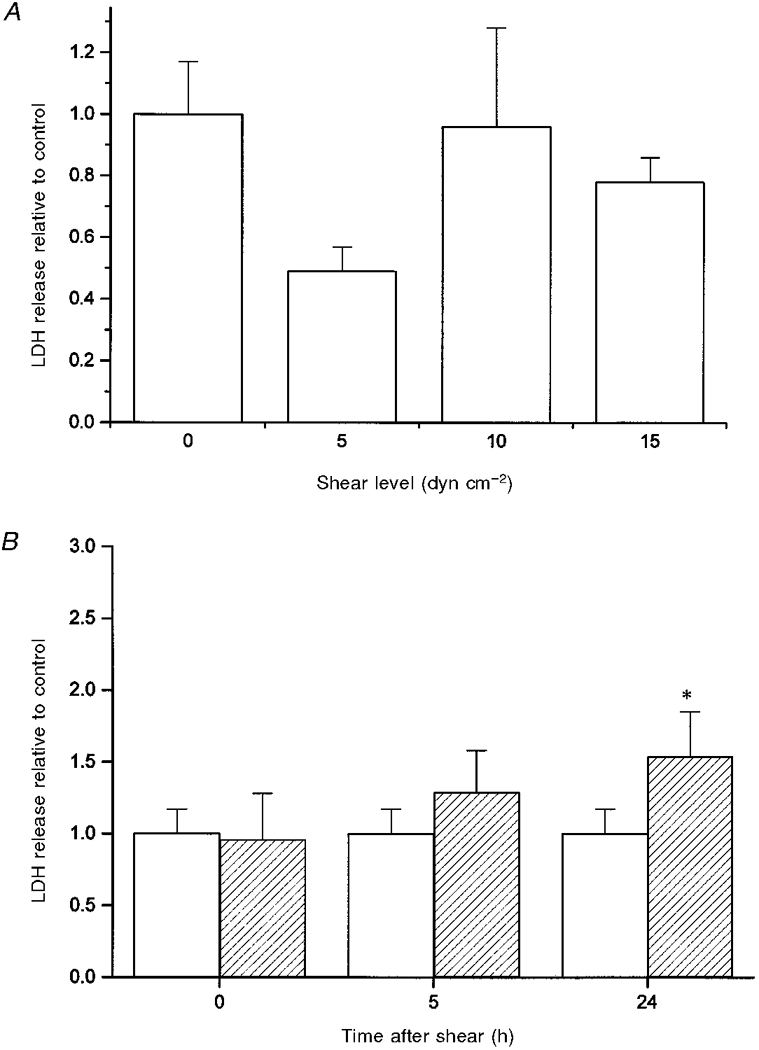
A, cells were unsheared (0 dyn cm−2, n = 10) or sheared at 37 °C for 90 min at 5 (n = 3), 10 (n = 7) or 15 dyn cm−2 (n = 4). LDH release was measured immediately after shear was terminated. For all data, the ratio of LDH release from the sheared cells relative to the control cells is given. B, cells were exposed to no shear (□) or shear for 90 min at 10 dyn cm−2 ( ). For unsheared controls, n = 10. For sheared samples at 0, 5 and 24 h after shear exposure, n = 7, 3 and 4, respectively. * Significant result relative to the unsheared control at 24 h (P < 0.05).