
Figure 6. Effect of shear stress on NO level in culture medium as a function of shear level (A) and time (B).
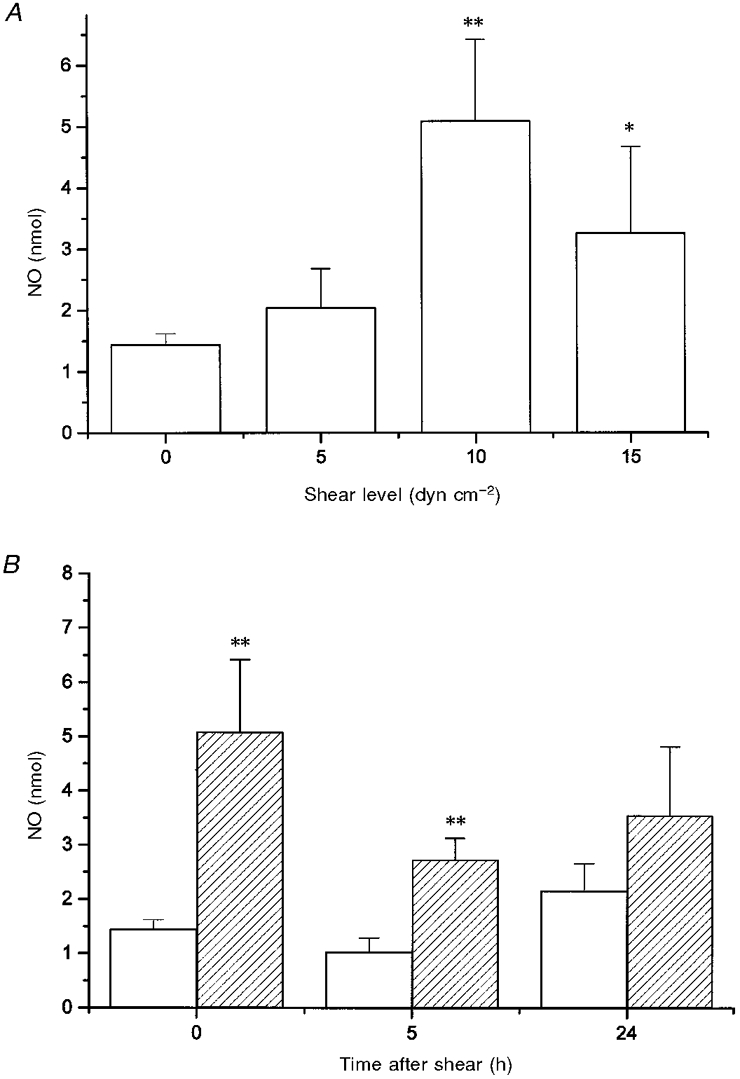
A, shear was applied at 37 °C for 90 min at 5, 10 and 15 dyn cm−2. The quantity of NO accumulated in the culture medium was determined from the amount of nitrite measured immediately after shear application was terminated. For all data, n = 7-12. Asterisks indicate the significance of the result compared with unsheared controls: * P < 0.05 and ** P < 0.01. B, representative plot of the effect of shear stress on NO level in the culture medium as a function of time after application of shear. Cells were exposed to no shear (□) or shear for 90 min at 10 dyn cm−2 ( ). At times 0, 5 and 24 h, n = 12, 3 and 4, respectively. ** Significant result relative to unsheared controls at the same time (P < 0.01).