
Figure 4. Voltage dependence of the closing (A) and opening (B) rates of the channel before (Control) and after (Terbutaline; 10 μM) application of terbutaline in cell-attached patches.
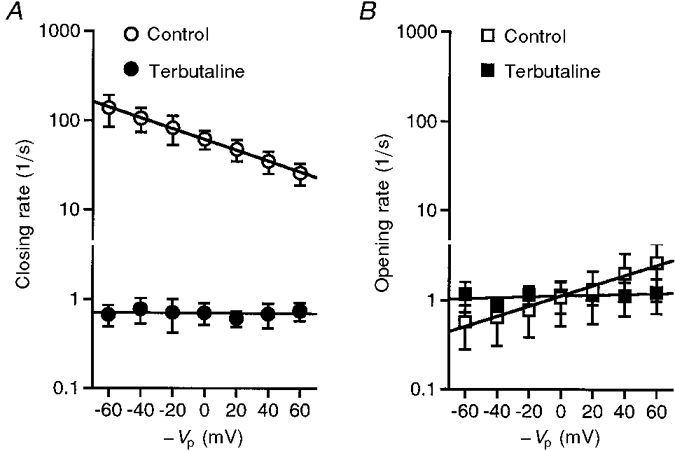
In the absence of terbutaline, as the membrane depolarized, the closing and opening rates significantly decreased and increased, respectively. The slope of the plot of log [closing rate]vs. voltage was −5.9 ± 2.4 s−1 V−1 (n = 5), which is significantly different from zero (P < 0.01). The slope of the plot of log [opening rate]vs. voltage was 5.3 ± 2.3 s−1 V−1 (n = 5), which is also significantly different from zero (P < 0.01). Changes in the membrane potential of 199 ± 94 and 217 ± 83 mV (n = 5) produced 10-fold changes in the closing and opening rates of the untreated channel, respectively. On the other hand, the closing and opening rates of the channel after application of terbutaline did not show any significant dependence on the membrane potential. The results were obtained from five individual cell-attached patches which contained only one channel per patch.