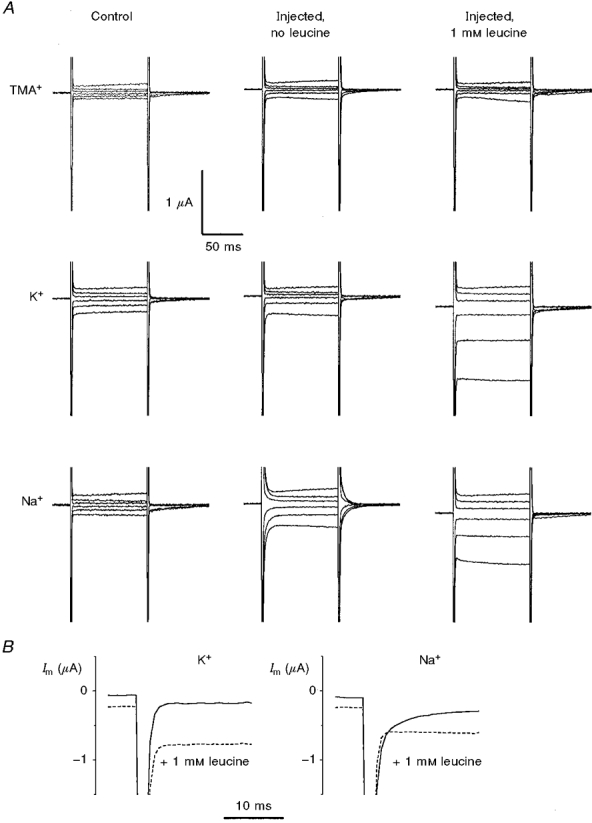
Figure 2. Voltage-dependent currents in control and KAAT1-expressing oocytes.

A, recordings of membrane currents (Im) elicited by voltage steps from Vh=−80 mV to −180, −140, −100, −60, −20 and +20 mV, in a control (left column) and in a KAAT1-expressing oocyte (middle and right columns) bathed in the indicated solutions. B, comparison of the relaxations (step voltage to −140 mV) with and without leucine for K+ and Na+ at a higher time resolution.
