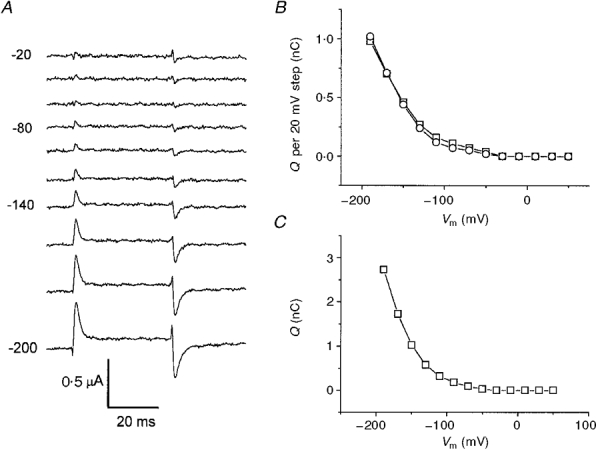
Figure 9. Charge movement in K+.

A, IK - ITMA during the 20 mV test pulses as in the protocol shown in Fig. 6A. B, integrals of the ‘on’ (□) and ‘off’ (^) transients from the traces in A, showing good correspondence with each other. C, cumulative integral from B.
