
Figure 10. Effect of Na+ concentration on charge movement.
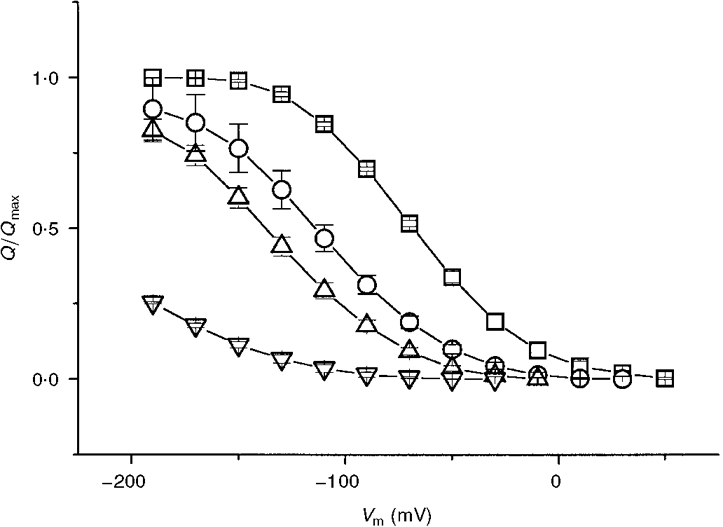
Normalized charge vs. voltage relationships for a group of oocytes bathed in 98 (□), 40 (^), 20 (▵) and 5 (▿) mM Na+ (TMA+ substitution). Data are means ±s.e.m. from 14 oocytes (two batches).