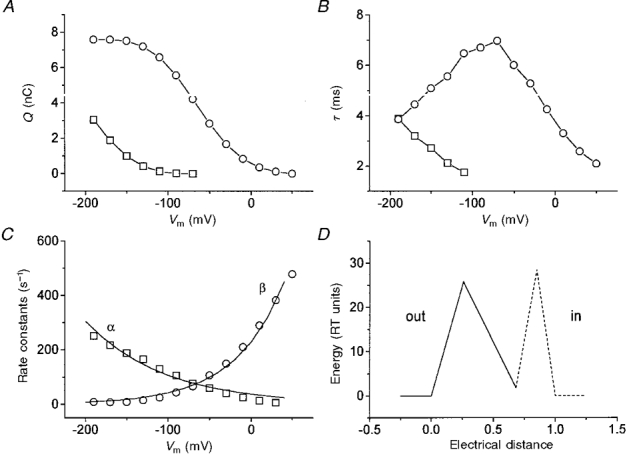
Figure 11. Calculation of forward and backward rate constants for binding of Na+ and K+ to the transporter.

A, moved charge and B, time constants vs. voltage in 98 mM K+ (□) and 98 mM Na+(^); C, forward (□) and backward (^) rate constants in 98 mM Na+; D, energy profile of the external barrier and binding site calculated as explained in the text; the dashed part is hypothetical. Continuous lines in C are functions for α and β fitted by eye. All data are from a single oocyte.
