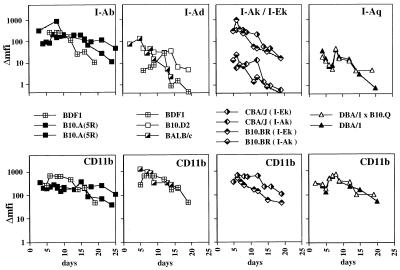
Figure 1.
Time courses of MHC class II expression on BMDMs of different haplotypes. Double stainings were performed with mAbs recognizing the various MHC class II molecules and CD11b. The time course of CD11b expression (Lower) and the corresponding MHC class II expression on CD11b+ cells (Upper) are shown. The Δmfi was calculated by subtracting the mfi of unstained cells from the mfi of stained cells. For each BMDM cultures, the bone marrow of 8–10 mice was pooled. The symbols representing BMDMs from the various mouse strains are indicated.

