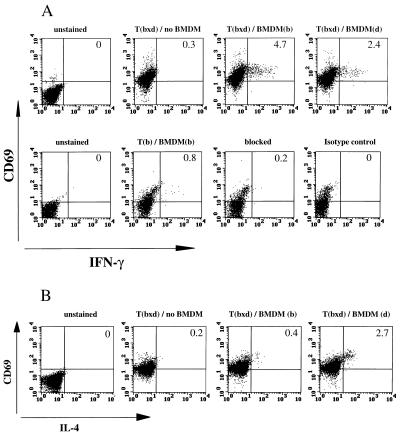
Figure 3.
FACS analysis of F1 T cells stained for intracellular cytokines. (A Upper) Staining for CD69 and IFN-γ of Tbxd cells of the B10 background with the anti-IFN-γ antibody (clone XMG1.2). The specificity of the staining is demonstrated (Lower). Second from left shows a staining with the anti-IFN-γ antibody (clone AN18.17.24), next is blocking with unlabeled AN18.17.24, and subsequent staining with FITC-labeled AN18.17.24. (Right) Corresponding isotype control. The B10 mice from which the T cells were derived had been immunized with KLH. (B) Staining for CD69 and IL-4 of Tbxd cells of the BALB background. The BALB mice from which the T cells were derived had been immunized with cIg. For FACS analysis, the T cells were restimulated in vitro with antigen and BMDMs of either parental haplotype. For control, neither antigen nor BMDMs were added. The percentages of double-positive cells are given in the upper right quadrants.

