
Figure 3. Exocytotic events and cell volume changes during the first minute of 1 μM ACh stimulation.
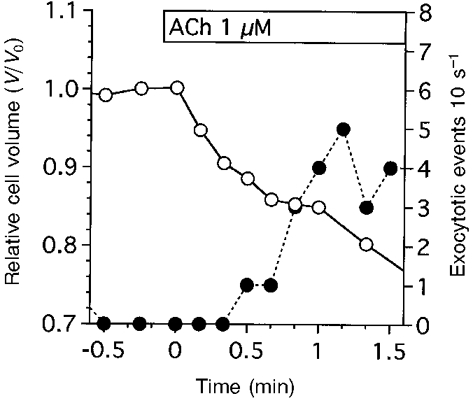
The frequency of exocytotic events (10 s−1) was counted and normalized to the cell number. This figure shows a typical case of cell shrinkage (○) and exocytotic events (•) evoked by 1 μM ACh. ACh stimulation evoked cell shrinkage immediately (within 5 s from the start of stimulation), while the exocytotic events began 20 s after ACh stimulation. The frequency of exocytotic events continued to increase until 1 min after ACh stimulation and thereafter was sustained. A further decrease in cell volume was also detected from 1 min after stimulation. As shown in Fig. 1C and H, the mucous cells lose their volume owing to granule release. Thus, the cell volume changes consisted of two phases: initial cell shrinkage and delayed cell shrinkage.